The raw data behind the story "Higher Rates Of Hate Crimes Are Tied To Income Inequality" https://fivethirtyeight.com/features/higher-rates-of-hate-crimes-are-tied-to-income-inequality/.
hate_crimes
Format
A data frame with 51 rows representing US states and DC and 13 variables:
- state
State name
- state_abbrev
State abbreviation
- median_house_inc
Median household income, 2016
- share_unemp_seas
Share of the population that is unemployed (seasonally adjusted), Sept. 2016
- share_pop_metro
Share of the population that lives in metropolitan areas, 2015
- share_pop_hs
Share of adults 25 and older with a high-school degree, 2009
- share_non_citizen
Share of the population that are not U.S. citizens, 2015
- share_white_poverty
Share of white residents who are living in poverty, 2015
- gini_index
Gini Index, 2015
- share_non_white
Share of the population that is not white, 2015
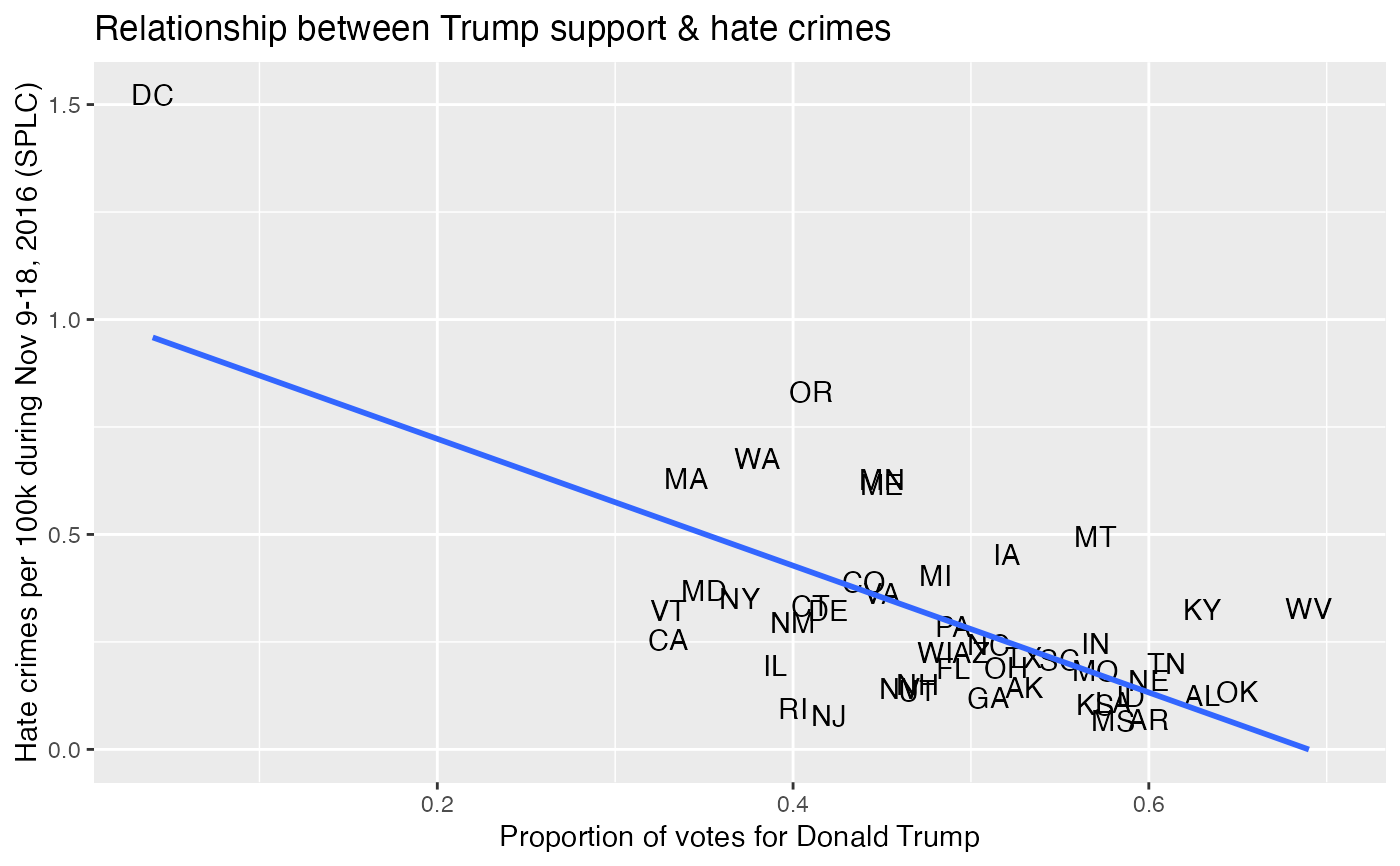
- share_vote_trump
Share of 2016 U.S. presidential voters who voted for Donald Trump
- hate_crimes_per_100k_splc
Hate crimes per 100,000 population, Southern Poverty Law Center, Nov. 9-18, 2016
- avg_hatecrimes_per_100k_fbi
Average annual hate crimes per 100,000 population, FBI, 2010-2015
Source
See https://github.com/fivethirtyeight/data/tree/master/hate-crimes
Examples
library(ggplot2) ggplot(hate_crimes, aes(x = share_vote_trump, y = hate_crimes_per_100k_splc)) + geom_text(aes(label = state_abbrev)) + geom_smooth(se = FALSE, method = "lm") + labs(x = "Proportion of votes for Donald Trump", y = "Hate crimes per 100k during Nov 9-18, 2016 (SPLC)", title = "Relationship between Trump support & hate crimes")#>#> Warning: Removed 4 rows containing non-finite values (stat_smooth).#> Warning: Removed 4 rows containing missing values (geom_text).